Being a software developer is like being a member of a band - things only sound good when everyone is playing the same song and is in sync. So, tearing ourselves away from our development environments onto Zoom calls to communicate is an important component for successful software delivery.
I work in consulting, and often I'll have to give presentations (internally and externally) to validate proposed solutions and solicit feedback. This means I make a lot of diagrams. Having a visual artifact helps align the miasma of meaning between everyone.
However, in the post-physical-presence workplace, whiteboards aren't present and ad-hoc drawing solutions with a mouse and keyboard resembles everything you've ever made in paint forever-ago on Windows 95.
And so, we must find tools to solve this problem...
Why not my favourite WYSIWYG?
Solutions do exist: draw.io, lucidcharts, jspaint, and whatever else you can think of (read: google for).
However, I cannot stand what-you-see-is-what-you-get software solutions for a myriad of reasons:
- They are inconsistent, particularly weeks and months apart. Icon libraries are updated, keyboard shortcuts are changed, ...
- They are non-uniform without painstaking attention to detail. This means it never happens. Font sizes, paddings, spacing between edges and nodes, ...
- They don't support change management well. I'm a developer - I want version control, code review, and a history of change.
- They are paid products. At scale, this is just another cost centre.
So, Python...?
Of course, Python comes to the rescue:

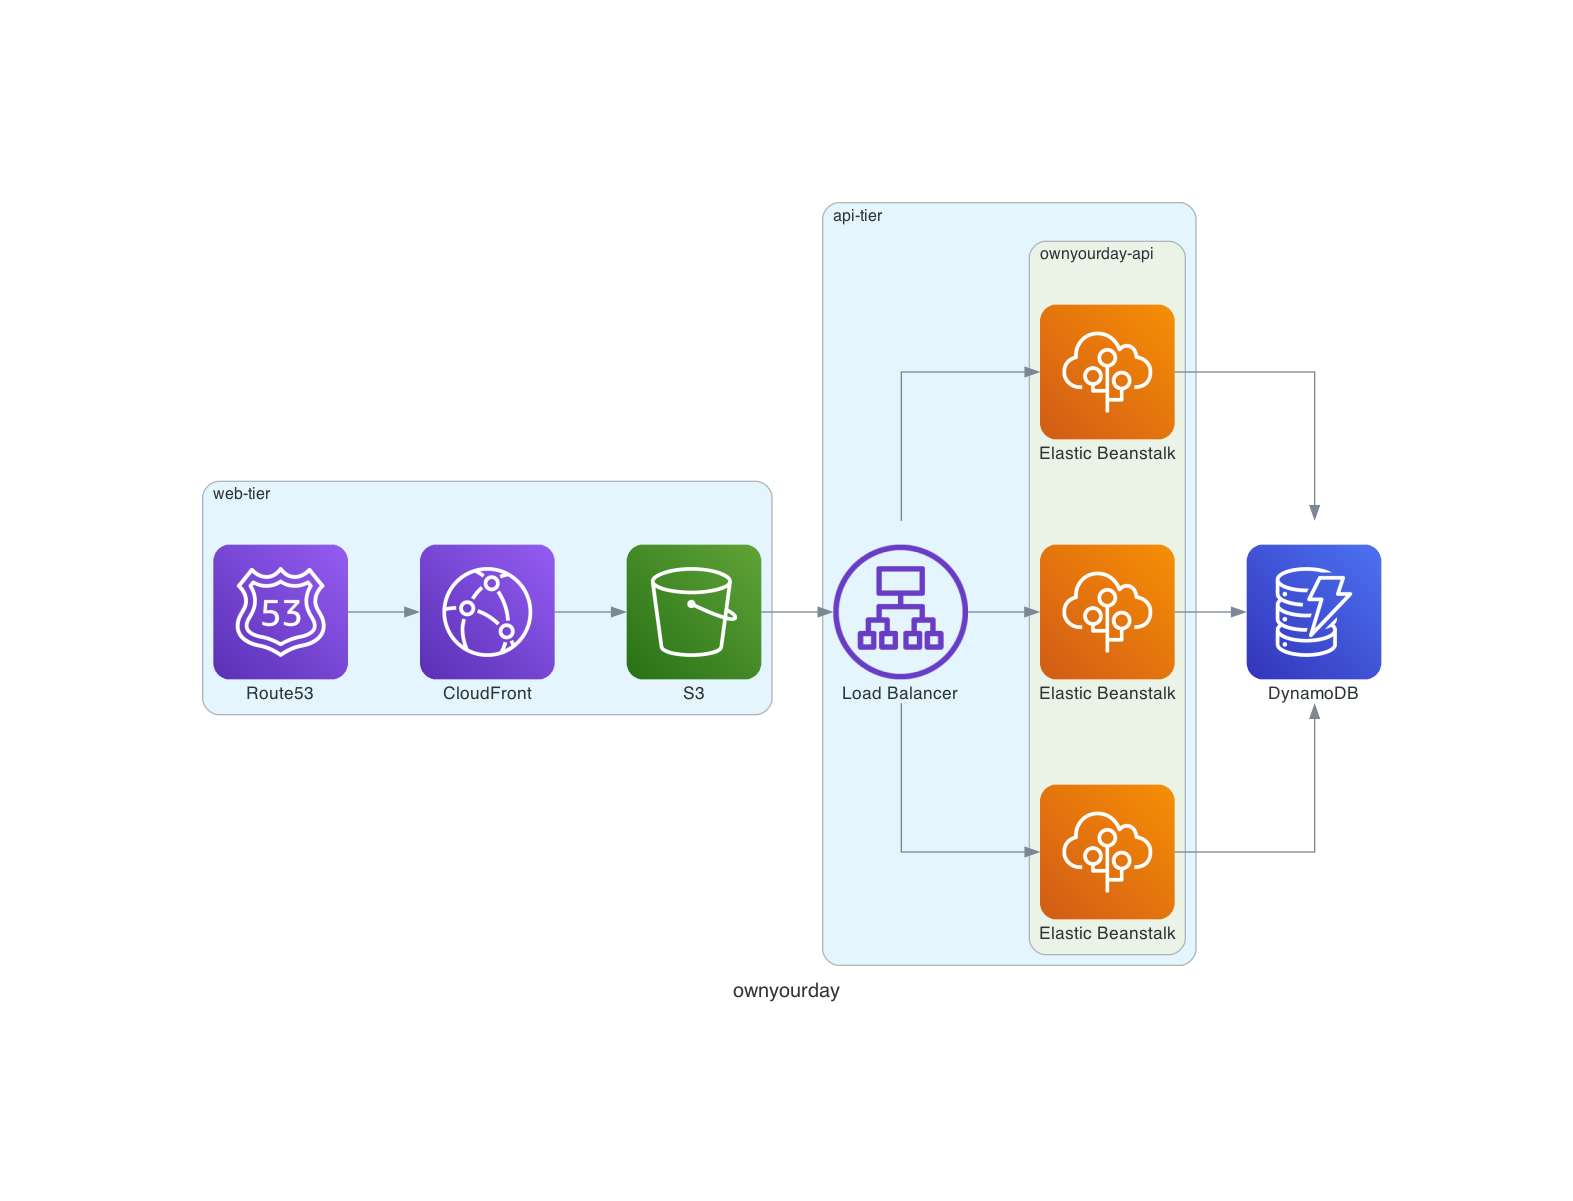
While working on a hobby project, I came across a wonderful library that solves the aforementioned problems: diagrams. This library allows authorship of cloud diagrams as a set of python statements. Since the diagram is generated from code, it should always be consistent and repeatable. Furthermore, it can be stored in version control. I tried it out to create a diagram of ownyourday's proposed architecture:
from diagrams import Diagram, Cluster
from diagrams.aws.compute import ElasticBeanstalk
from diagrams.aws.database import Dynamodb
from diagrams.aws.network import Route53, CloudFront, ALB
from diagrams.aws.storage import S3

with Diagram("ownyourday", show=False):
    with Cluster("web-tier"):
        dns = Route53("Route53")
        cdn = CloudFront("CloudFront")
        spa_artifact = S3("S3")

    with Cluster("api-tier"):
        load_balancer = ALB("Load Balancer")
        with Cluster("ownyourday-api"):
            api_group = [
                ElasticBeanstalk("Elastic Beanstalk"),
                ElasticBeanstalk("Elastic Beanstalk"),
                ElasticBeanstalk("Elastic Beanstalk"),
            ]

    database = Dynamodb("DynamoDB")

    dns >> cdn >> spa_artifact
    spa_artifact >> load_balancer >> api_group >> database
The results are:

I'll be using this technique both in my personal work and my professional work going forward.
Make sure to give diagrams a GitHub star if you feel the same.